ข้อสอบ Writing ประกอบด้วย
WRITING TASK 1
1. Writing Task 1 (a report on a chart)
เป็นการเขียนรายงานข้อมูลจากกราฟ, สถานที่ และขั้นตอน กระบวนการต่างๆ โดยคิดคะแนนจากส่วนนี้ประมาณ 33% ลักษณะข้อสอบแบ่งออกเป็นดังนี้
Trend/Comparison กราฟชนิดต่างๆ เช่น กราฟเส้น กราฟแท่ง กราฟวงกลม ตารางข้อมูล ข้อสอบแนวนี้ แบ่งเป็นการเขียน 3 ย่อหน้า ดังนี้
| Introduction | Introduce the graph by using paraphrasing tactics (ideally 1-2 sentences).
ใช้หลักการ Paraphrase โจทย์เพื่อนำเสนองานเขียน |
| Overview | Describe main trends.
เขียนการเปลี่ยนแปลงที่เด่นชัดภายในกราฟ Note. การเขียน overview สามารถนำเสนอได้ทั้งในพารากราฟสองหรือพารากราฟสุดท้าย |
| Body | Describe data in detail.
เขียนอธิบายลงลึก เพื่อการนำเสนอตัวเลขในแต่ละช่วงของเวลา |
ตัวอย่างข้อสอบ

The line graph illustrates the data of energy usage in the USA since 1980 to a prediction in 2030.
Summarize the information by selecting and reporting the main features, and make comparisons where relevant. Write at least 150 words.

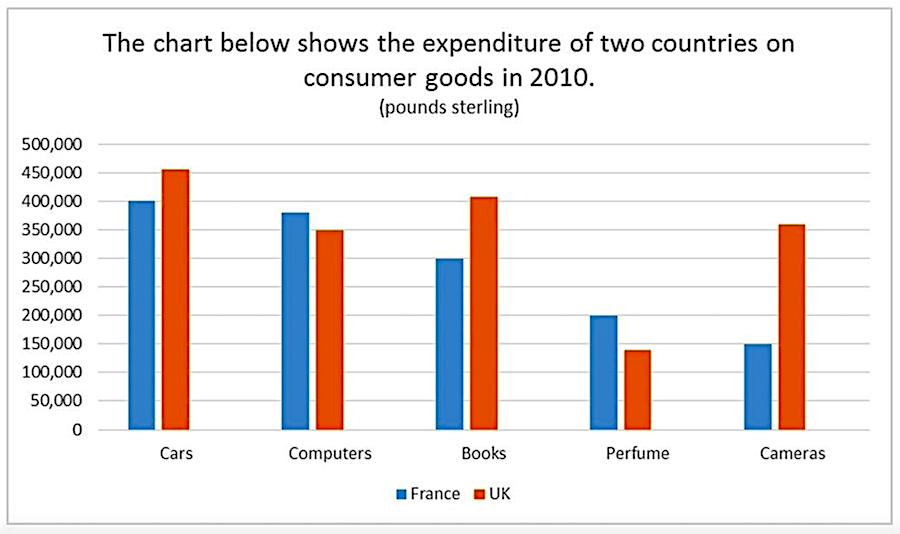
The chart illustrates the amount of money spent on five consumer goods (cars, computers, books, perfume and cameras) in France and the UK in 2010. Units are measured in pounds sterling.
Summarize the information by selecting and reporting the main features, and make comparisons where relevant.

The charts below show the percentage of water used for different purposes in six areas of the world.
Summarize the information by selecting and reporting the main features, and make comparisons where relevant. Write at least 150 words.

The table shows percentage of children with different educational problems in two primary schools.
Summarize the information by selecting and reporting the main features, and make comparisons where relevant. Write at least 150 words.
Maps ภาพเปรียบเทียบของสถานที่ๆหนึ่งระหว่าง 2 ช่วงเวลา ข้อสอบแนวนี้ แบ่งเป็นการเขียน 3 ย่อหน้า โดยมีเนื้อหา ดังนี้
| Introduction | Introduce the graph by using paraphrasing tactics (ideally 1-2 sentences).
ใช้หลักการ Paraphrase โจทย์เพื่อนำเสนองานเขียน |
| Overview | Describe main change.
เขียนการเปลี่ยนแปลงที่เด่นชัดที่เกิดขึ้นในอดีตและปัจจุบัน Note. การเขียน overview สามารถนำเสนอได้ทั้งในพารากราฟสองหรือพารากราฟสุดท้าย |
| Body | Describe data in detail.
นำเสนอการเปลี่ยนแปลงที่เกิดขึ้นโดยลงรายละเอียดอย่างชัดเจน |
ตัวอย่างข้อสอบ

The maps below show the changes in a town after the construction of a hydroelectric power dam.
Summarize the information by selecting and reporting the main features, and make comparisons where relevant. Write at least 150 words.
Process/Diagram ภาพที่แสดงขั้นตอนหรือกระบวนการเกิดขึ้นของสิ่งต่างๆ เช่น วงจรการเกิดของปลาน้ำลึก หรือ ขั้นตอนการผลิตแป้นพิมพ์ เป็นต้น แบ่งเป็นการเขียน 3 ย่อหน้า ดังนี้
| Introduction | Introduce the graph by using paraphrasing tactics (ideally 1-2 sentences).
ใช้หลักการ Paraphrase โจทย์เพื่อนำเสนองานเขียน |
| Overview | Describe overall process( how many steps, what are the beginning and the end)
นำเสนอภาพรวมของกระบวนการนั้นๆ โดยให้ข้อมูลจำนวนขั้นตอน, ข้อมูลขั้นตอนแรกและขั้นตอนสุดท้าย Note. การเขียน overview สามารถนำเสนอได้ทั้งในพารากราฟสองหรือพารากราฟสุดท้าย |
| Body | Describe data in detail.
นำเสนอกระบวนการที่เกิดขึ้นอย่างละเอียด |
ตัวอย่างข้อสอบ

The diagram shows the water cycle, which is the continuous movement of water on, above and below the surface of the Earth.
Summarize the information by selecting and reporting the main features, and make comparisons where relevant.
